
In the first part of the AccelOps review, I gave a quick overview of its many features.
In Part 2, I'd like to dig a bit deeper, and cover information that serves both security and network teams – specifically dashboards, rules, logical business groups, virtual appliance and a quick and simple MARS comparison.
Dashboards
One of the items where AccelOps excels is dashboards, and there are plenty of them. You will find ready-made dashboards for Incidents, applications, security and VMware to name a few – and their display is tied into your login. What this means is that you can have for example, security in one view, performance in another, etc. and pretty easily adjust the views you like- by display type, number of columns, over what time period and how many results. Some dashboards include topology maps with incident overlays. Elements within dashboards have additional highlight details or support the means to drill down to more relevant information.
In Part 2, I'd like to dig a bit deeper, and cover information that serves both security and network teams – specifically dashboards, rules, logical business groups, virtual appliance and a quick and simple MARS comparison.
Dashboards
One of the items where AccelOps excels is dashboards, and there are plenty of them. You will find ready-made dashboards for Incidents, applications, security and VMware to name a few – and their display is tied into your login. What this means is that you can have for example, security in one view, performance in another, etc. and pretty easily adjust the views you like- by display type, number of columns, over what time period and how many results. Some dashboards include topology maps with incident overlays. Elements within dashboards have additional highlight details or support the means to drill down to more relevant information.

Specialized dashboards exist for availability, performance, security, and biz services and you can build your own. The specialized dashboards are collections of widgets that provide information about specific functions. Any built-in or custom reports or saved searches are available as templates that can be used for dashboard widgets. The widgets in the dashboards offer five different display types: Aggregation View (Pie) - 1, Aggregation View (Bar) - 2, Tabular View - 3, Trend View - 4, and Combo View - 5.
Here you can see examples of top-firewall- reports, and login-failed-reports.
Here you can see examples of top-firewall- reports, and login-failed-reports.
Now remember MARS really concentrates on security logs and monitors netflow, where as AccelOps, also understands many applications as well.
Searches
Searches

Accelops has really improved the search function. Searches can be carried out in realtime and historically. You can conduct a Google-like search and add SQL like expressions, ie, Logon/Logoff AND administrator. In the results there is also a real-time intensity graph, common in most SIEM these days, and all the results have drop down menu selectors, which vastly improves the speed that you can drill down into the information you need. They also provide a structured search that offers considerably more functionality including the Group By expression to put together useful reports. Searches can be saved as reports – see Part I regarding reporting.

Rules/Tuning
SIEMs must have a solid rules engine. You can have event-based rules, statistical threshold based rules, time of the day based rules, etc. Better still, you can easily create rule exceptions that wont fire during your maintenance hours, or if your server already has Microsoft patch X that fixes a particular vulnerability.
Rules can be created, from over 300 source attributes, and there is a competent mixture of useful existing performance, availability, change, security and compliance rules built-in (that can be copied and edited).
Rules can be created, from over 300 source attributes, and there is a competent mixture of useful existing performance, availability, change, security and compliance rules built-in (that can be copied and edited).
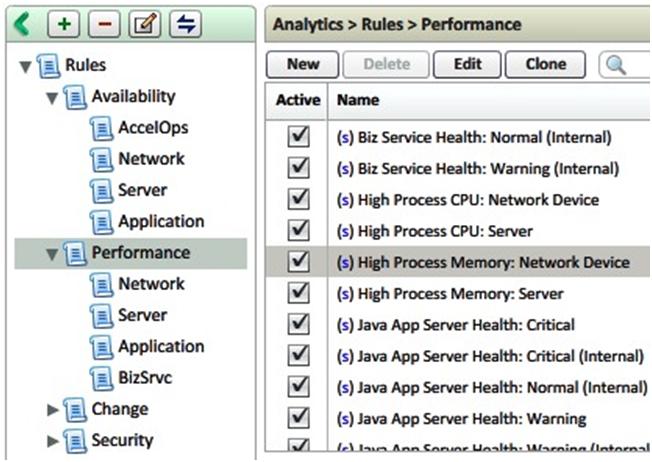
AccelOps supports simple thresholds analytics to complex nested logic that could describe a variety of scenarios. Rules can be applied to devices, conditions and even services (described below). The rule language supports multiple sub-patterns (AND, OR, FOLLOWED_BY,..), broad operators (equals, greater than, contains, between,...), etc.
As an example, the DNS Botnet rule, better explained by pictures below, but basically rules can reference other rules. The DNS Botnet Rule, references 3 other rules, and all 3 must match before an Incident is created.
If this pattern occurs, that references the 3 other rules, generate an Incident
As an example, the DNS Botnet rule, better explained by pictures below, but basically rules can reference other rules. The DNS Botnet Rule, references 3 other rules, and all 3 must match before an Incident is created.
If this pattern occurs, that references the 3 other rules, generate an Incident

Where as an example one of the rules, is looking at ExcessiveDNS queries by Flow Data or Log Data..


I think you get the idea, lots more flexibility, and applications, flow data and conditions etc can be referenced.
Services
AccelOps has the notion of a business service that is a smart container of network devices, servers and applications serving a common business purpose. Within their CMDB, users can create a business service via a wizard that starts with the user selecting an app or device category – let’s say an ecommerce database application. AccelOps will show all the specific database applications and then specific servers. By selecting the application server, it will also automatically bring up the layer-3 devices such as switches. Once the specific web server and layer-3 devices are added to the defined service, any rules associated with those monitored devices are inherited by the service.
Services
AccelOps has the notion of a business service that is a smart container of network devices, servers and applications serving a common business purpose. Within their CMDB, users can create a business service via a wizard that starts with the user selecting an app or device category – let’s say an ecommerce database application. AccelOps will show all the specific database applications and then specific servers. By selecting the application server, it will also automatically bring up the layer-3 devices such as switches. Once the specific web server and layer-3 devices are added to the defined service, any rules associated with those monitored devices are inherited by the service.

This is an intelligent approach to understanding device relationships, tracking services and pinpointing any issues affecting services. Every incident is tagged with the affected business service and can be used to prioritize responses.. So you can very quickly identify, if Switch X goes down, what applications and services will be impacted on the network. So beyond severity, AccelOps shows business impact.

Services can be monitored, not only parsing the logs and other sources such as Netflow for stopped and started services or changed configuration, but also by synthetic transaction monitoring tests. Users can define and monitor simple or nested transactions from the likes of HTTP, LDAP, DNS, FTP, SMTP etc. The results of these tests can determine if a particular service is hung (or slow) and the server thinks it is working but it is not responding. Rules can also reference synthetic transactions results.
Appliance/Software vs. Virtual Appliance
One complaint I see with standard SIEMs, is that they can be too slow running queries, especially if you are firing in many events. In the case of hardware appliances, when you have bought the hardware, you are pretty much stuck with it. This presents problems once you reach the processor’s limit, or a new feature comes out for a later model or when storage capacity is reached. Now the AccelOps solution is a virtual appliance that uses your hardware running VMWare. VMware provides advantages for availability and performance, and makes AccelOps very scalable. If capacity is maxed out or queries get sluggish, simply have VMware reserve more capacity or license and fire up another VM image of the AccelOps virtual appliance. As part of a cluster, it automatically load balances the processing. AccelOps separated computation functions from storage, so using VMware, you just reference the NAS/SAN storage amount, and configure it to your RAID liking – and add more as required.. All the data is online – no need to restore partial archives. Maintaining the system, including updates or adding new device parsers, can be achieved with little effort.
One complaint I see with standard SIEMs, is that they can be too slow running queries, especially if you are firing in many events. In the case of hardware appliances, when you have bought the hardware, you are pretty much stuck with it. This presents problems once you reach the processor’s limit, or a new feature comes out for a later model or when storage capacity is reached. Now the AccelOps solution is a virtual appliance that uses your hardware running VMWare. VMware provides advantages for availability and performance, and makes AccelOps very scalable. If capacity is maxed out or queries get sluggish, simply have VMware reserve more capacity or license and fire up another VM image of the AccelOps virtual appliance. As part of a cluster, it automatically load balances the processing. AccelOps separated computation functions from storage, so using VMware, you just reference the NAS/SAN storage amount, and configure it to your RAID liking – and add more as required.. All the data is online – no need to restore partial archives. Maintaining the system, including updates or adding new device parsers, can be achieved with little effort.
Brief Comparison Table
MARS – Device support is mostly Cisco and a few select third party (no support beyond current devices as per Cisco notification); netflow v5, v9, SNMP v1, v2, v3;
AccelOps – Cisco devices and growing vendor list – (can updates without a new release), netflow v5, v9, SNMP v1, v2, v3.
MARS – Integration with CSM and Cisco IPS Sensors (pull direct IPS raw packet traces)
AccelOps – Does not support CSM but supports Cisco and all other major IDS/IPS vendors. Also has IDS/IPS false positve tagging to reduce noise regarding invalid incident alerts.
MARS – Basic level of device attributes (hard coded) and modest reporting flexibility (no dashboards)
AccelOps – Extensive device attributes, easy to update with extensive search, reporting and dashboard capabilities
MARS – Device support is mostly Cisco and a few select third party (no support beyond current devices as per Cisco notification); netflow v5, v9, SNMP v1, v2, v3;
AccelOps – Cisco devices and growing vendor list – (can updates without a new release), netflow v5, v9, SNMP v1, v2, v3.
MARS – Integration with CSM and Cisco IPS Sensors (pull direct IPS raw packet traces)
AccelOps – Does not support CSM but supports Cisco and all other major IDS/IPS vendors. Also has IDS/IPS false positve tagging to reduce noise regarding invalid incident alerts.
MARS – Basic level of device attributes (hard coded) and modest reporting flexibility (no dashboards)
AccelOps – Extensive device attributes, easy to update with extensive search, reporting and dashboard capabilities
MARS – Topology Graphs are Static
AccelOps – Topology Graphs are dynamic (eg. incident and stat overlays), can be saved, and items moved around! Very customizable dashboards.
MARS – No CMDB or business service concept
AccelOps – Automated CMDB with config. versioning and business service component grouping
MARS – Case Management
AccelOps – Case Management with incident filtering, auto-suppression rules, exception management and full ticketing.
MARS – Designed for Single Enterprise Users
AccelOps – Designed for Enterprise, and Multi-Tenancy, very suitable for MSSPs.
MARS – Restricted Disk Space by Appliance; weeks to months of data, requires archiving
AccelOps – Hybrid data management; does not have that problem – everything online, long-term
AccelOps – Yes with virtual appliance dynamic clustering, remote collector virtual appliances and multi-tenancy. Has EPS-elasticity to support peak event/log spikes with dropping data.
To summarize. AccelOps is well suited to support mid to large enterprise and service provider's security and network teams alike.
AccelOps is a SIEM and more than a SIEM. The product works right out of the box. It is also customizable and as a virtual appliance – pretty simple to expand out. And at the same time, it has the capabilities to reduce multiple tools in the Enterprise. Definitely one to put on your shortlist if you are looking for a new, or to replace your current SIEM / log management solution.
I hope you enjoyed my overview of AccelOps (prior ver. 1.6.4 and more recently ver2.1). Next, I’m going to look at some more of the Cisco SIEM Deployment Guides, starting with the Cisco Security Application for Splunk.





 Support for Windows 2008—Cisco Security MARS provides agent based, native log support for Windows 2008 server hosts. Users can send syslog to CS-MARS by installing a Snare agent on their Windows 2008 server hosts.


 Posts
Posts


